

You should spend about 20 minutes on this task.
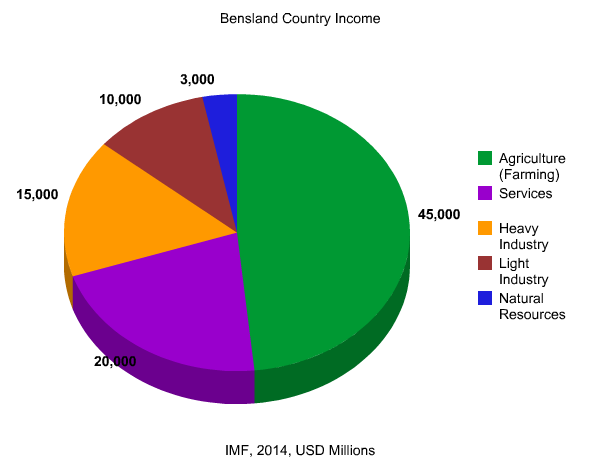
The pie chart shows Bensland Country income.
Summarize the information by selecting and reporting the main features and make comparisons where relevant.
Write at least 150 words.
NOTES.
You should:
A. Introduce the graph / chart
B. Give an overview
C. Describe the main features
D. D. You may or may not give a short conclusion
A. Introduce the graph / chart.
For this, you need to paraphrase the input and state what the IELTS writing task represents.
B. Give an overview.
This clearly states the main trend or most noticeable piece of information from the graph or chart. You should not include details from the chart just yet. At first you just need to describe what you can see in general.
C. Describe the main features.
Describe the graph in more detail. Refer back to the data and nothing else, stating what is similar and what is different. Comparative structures are useful here.
D. Write a short conclusion.
Although not completely necessary, you can include with a short conclusion. This should tie the whole piece of writing together.