

The first chart below shows how energy is used in an average Australian household. The second chart shows the greenhouse gas emissions which result from this energy use. Summarize the information by selecting and reporting the main features and make comparisons where relevant.
TASK RESPONSE.
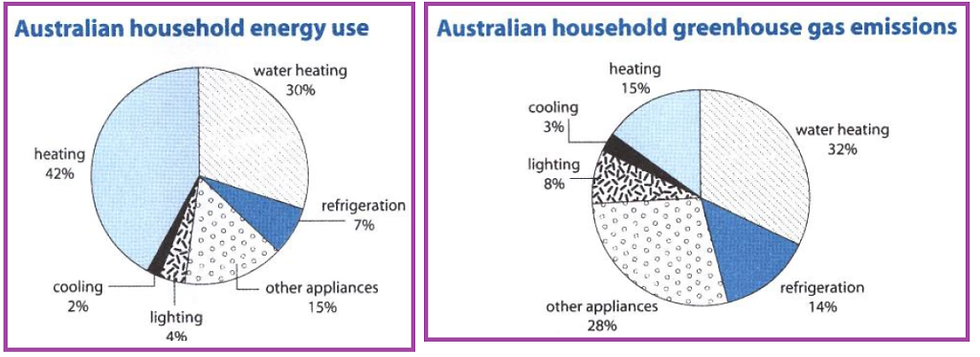
The two pie charts demonstrate the energy consumption in an average Australian household and the release of greenhouse gas emitted from energy utilization per household.
As exhibited, other appliances cause considerably large amount of greenhouse gas while heating accounts for the lowest contributor of hazardous gas. The percentage of gas discharged by lighting is twice the amount of energy it consumes.
Heating holds highest proportion of energy usage at 42% while water heating consumes 30% of energy, 12% less of heating. Energy utilized for refrigeration is 7% which is about half of that consumed by other appliances that accounts for 15%. Lighting and cooling consume the least, at 4% and 2% respectively, a difference of 2%.
The second pie chart manifests that 32% of greenhouse gas emission is caused by water heating whereas heating releases only 15% of gas, almost half water heating. Refrigeration causes 14% of emission while other appliances contribute twice that amount - 28%. That said, the amount of greenhouse gas discharged by lighting, and cooling is 8% and 3% respectively.